
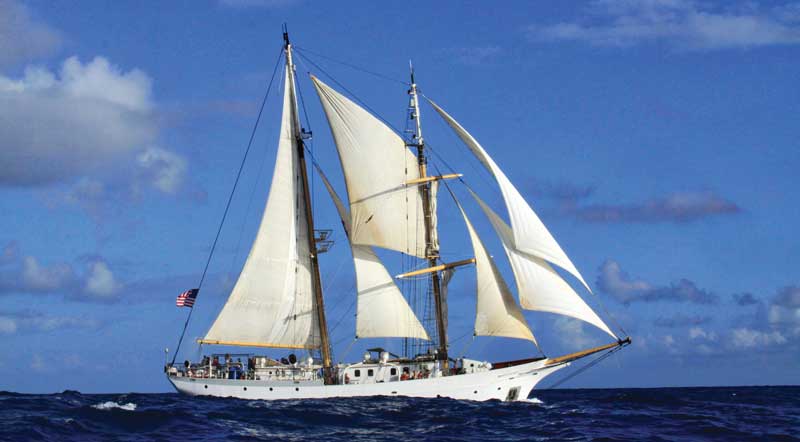
 Elliot Rappaport has sailed on a number of training vessels including the Woods Hole-based Sea Education Association vessel SSV Robert C. Seamans. Photo courtesy Sea Education Association, www.sea.edu
On board the sailing school vessel Robert C. Seamans—near East Cape, New Zealand, March 2020:
The weather finds us in late afternoon—a dark swath of ripples moving across smooth water, the shearline between two great atmospheric masses. The clouds are long tubular billows, trailing a curtain of rain like steam. Suddenly it is colder, the indolent summer suddenly forgotten. We trim our few remaining sails and keep the wind to starboard, hurrying to close deck hatches as the rain reaches us. In an hour we have a gale as promised—45 knots of wind from the south, the sea pushed up into blue-gray hillocks with tumbling foam piles on top. Our progress halted, we lie hove to—using a balance of canvas and rudder to keep us parked obliquely to the elements, rising and falling like a cork as things swirl past. Curtains of rain pelt the sea and whistle through the slots between deck structures. After dark we permit only a few hands on deck to keep watch, in a noisy black world where the vibrating halyards turn our masthead lights into flickering strobes. Anything that looked secure a day ago seems suddenly fragile, and the process of just thinking about what might go wrong is tiring all on its own. My friends at home are eager to hear sea stories, but for the most part real tales of heavy weather involve simple endurance—low-grade misery, a constant queasy vigilance in anticipation of some cascading mishap.
The standardization of weather data into their modern form began early in the nineteenth century, thanks in large part to the efforts of a British naval officer named Francis Beaufort. Prior to then, ships recorded wind and sea conditions with no small measure of subjectivity. To wit: 19 January. We suffered a whole greate gale of wynde on this day, rending the sea into tumultuous spyndryft.
You get the idea. Beaufort was a gifted hydrographer, father to the famed system of British Admiralty Charts that remain the gold standard for navigators to this day. But best known of his legacies is the universal scale for wind velocity that now bears his name, a twelve-tiered matrix binding sea state and wind strength together as a combined measurement. By correlating wind speed with visual observations of the sea surface, the Beaufort Scale enables a mariner to make repeatable measurements without any instruments at all—and while later versions include numerical wind speeds to go along with the original duodecimal steps, the scale at its heart is a measurement of force, not simply velocity.
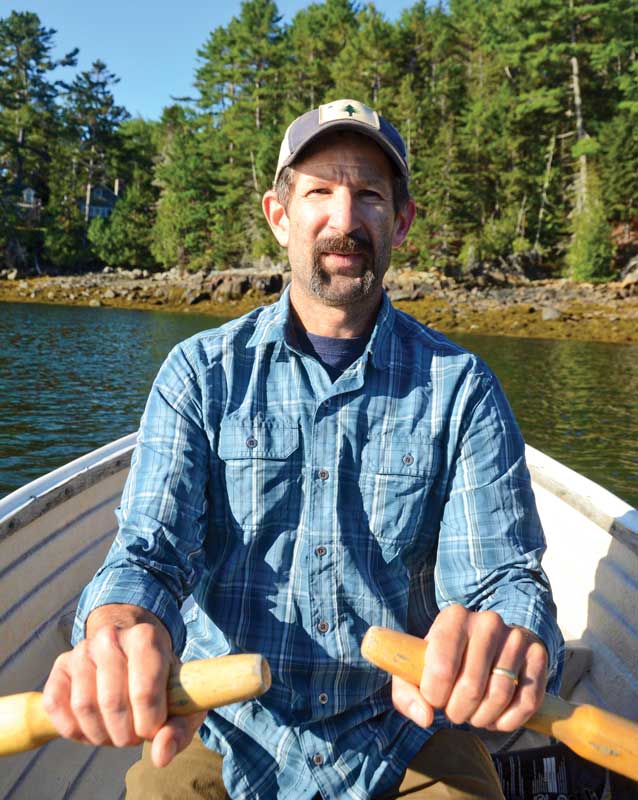 The author practicing his seamanship in a small tender. Photo by Stephen RappaportA captain in his own right, Beaufort aimed to explain what the wind was doing to the water as it blew, thus crafting a sort of universal operating manual for sailing ships. Beaufort force 6 (a strong breeze of around 25 knots) is the point at which wind and sea conditions generally start to become a discernable challenge for small craft. Force 8, a gale, is between 34 and 40 knots, and is where marine weather forecasts begin to include direct warnings about wind strength. “Upper topsails shall be struck,” Beaufort might advise in his original version, or in modern doctrine: “Transits in gale conditions should be undertaken with extreme caution and only by properly equipped seagoing vessels.”
The force of wind can be considered in rough terms using the standard expression for kinetic energy, which (for math lovers) is an exponential square function: F = ½ mv2
This relationship means that wind force (F) will quadruple with a doubling in the velocity (v). A 20-knot wind hence feels four times as powerful as a 10-knot wind. A force 8 gale, only 10 knots above a force 6 strong breeze, will double the pressure on your sails. If you plot this relationship on a graph, it makes a hockey-stick shape, just like the Keeling CO2 curve in climate science. On the graph of wind force, a gale sits right around the inflection point, where the curve slope transitions from horizontal to vertical. For the average person in town, this would be when simply walking around became a real challenge. An urban version of the Beaufort scale might look like this:
- Force 6: Umbrellas ruined.
- Force 8: Café furniture blows into street; pedestrians cannot walk in straight line.
- Force 10: Don’t go out.
- Force 12: Call 9-1-1.
Waves, built by the wind, are measured according to their height, from peak to trough, and period, the time in seconds between successive wave peaks. Waves only grow while they are involved with the wind that’s forcing them. Once the wind stops, waves persist in the form of swells, retaining momentum for what can be thousands of miles. The most energetic waves travel farthest and last the longest. Surfers listen assiduously to data from offshore buoys, watching for signs of the long-period swells that will come ashore as monster breaks. I’m often asked what the biggest wave is that I’ve ever seen. Outside of a boat ride I once took to watch a surfing event in Tahiti, the best answer I can give is, I’m not sure. Anybody who goes to sea for a living has probably seen 20-foot seas often, and 30-footers on occasion. There are multiple contenders in play for the title of tallest wave ever measured, but it is generally accepted that waves of 60 feet are not uncommon in certain oceans.
The most frightening story of big waves that I’ve ever heard came from my friend Rick Fehst, who’s been a captain for many years in the Alaskan crab fishery. Hurricane-strength winter storms are common in the Bering Sea, as frigid, bone-dry air blows across Siberia and piles into the warm currents of the western Pacific. For a crab boat heavy with fuel and gear, I learn, the preferred technique in such conditions is to steam directly into the wind and waves, maneuvering to meet each sea bow-on. In 70 knots of wind, this is not a job for amateurs, and Rick explains what’s necessary to get it done while he tends to some salmon fillets on his barbecue.
“In 35- or 40-foot seas,” says Rick, “you need to square up on each one and go full speed ahead to make sure you make it up the face of the wave. Sometimes the tops are breaking, and then you need to go full astern, so you don’t hit the foam pile too hard and get your wheelhouse windows blown in. After that you get down on your knees and duck for shelter behind the bridge console. There have been skippers blown right out the back of their wheelhouses and over the side in stuff like this. Then you’re back up on your feet and giving it full ahead to get lined up for the next wave, which may be coming from a different direction. I’ve spent up to 36 hours at a stretch in the chair doing this and having the crew bring me coffee and sandwiches to keep me going.”
It is a riveting account, equal parts survival and my-day-at-the-office. Rick first drifted up to Alaska in his 20s, looking for money to pay for film school. In a pattern that I recognize from my own career, some latent aptitude and the year-on-year accrual of time turned a detour into a vocation, obscuring whatever career plans had gone before. Now boat owners compete for his services, and his wife, Ann Nora, is managing physician of the medical clinic in Dutch Harbor—where her specialty is repairing damaged fishermen so that they can return quickly to their paid occupations. As far as I know, Rick is still waiting to make a movie.
It is thirty-six hours before the wind diminishes enough for us to resume our progress toward the south. The tall clouds of the cold front are followed by a day of grim overcast, bands of showers and a wind that feels the utter opposite of summer. There is nothing, I am reminded, between New Zealand and Antarctica. The barometer tells the story of what’s come to pass, a slow and tepid descent followed by a brisk rise as the cold dense blast of subpolar air makes its arrival. During this time we have drifted backward 50 miles, lost ground that is shown discouragingly on the damp chart by a wandering regression of pencil marks. Somebody has drawn a frowny face on a post-it note and stuck it next to our plot. This sort of levity is discouraged in navigation, but it’s fair to say that everyone feels the same way about the last day and a half.
✮
 Excerpted from Reading the Glass, A Captain’s View of Weather, Water, and Life on Ships, by Elliot Rappaport, Dutton, 2023. Rappaport has sailed as a captain in the U.S. maritime industry since 1992 aboard a variety of traditional training ships. He is on the faculty at Maine Maritime Academy and lives in coastal Maine when not at sea.