By Polly Saltonstall
The era of cartographers drawing charts is coming to a close. NOAA’s Office of Coast Survey has announced plans to phase out completely its production of traditional paper charts over the next five years in favor of electronic vector charts based on digital data.
The announcement came in a notice posted Nov. 15 in the federal register seeking comment on the timing and other details of the transition, but not the change itself.
The shift has been driven both by the need for cost savings and by the potential to provide more and better information on electronic charts, said Capt. Chris van Westendorp, NOAA chief, Navigation Services Division, Office of the Coast Survey.
The savings from eliminating the raster charts will allow NOAA to allocate more resources toward improvements on the electronic ones, he said. “Instead of 1,000 charts in each production line, we will have 8,000 to 9,000 charts),” he said. “Also, there will be more detail and things that are ultimately able to help the mariner.”
He noted that mariners still will be able to get a paper version of the electronic data. NOAA is developing a chart application where users either can print out their own charts or have them printed by vendors. (https://devgis.charttools.noaa.gov/pod/)
“This custom chart tool will enable people to have paper charts; but they just will be coming from ENC data,” van Westendorp said.
While NOAA stopped printing its own paper charts in 2013, it has continued to provide digital files to private contractors who have printed and sold traditional so-called raster charts. These charts are drawn by cartographers, unlike electronic navigational charts (ENC for short), which are created completely from digital vector data and are not as visually user friendly. It’s a shift similar to the transition in cars from paper atlases to GPS navigation systems.
Ultimately, production will be shut down for all raster chart products and services associated with traditional NOAA paper nautical charts, including: print-on-demand paper nautical charts, full-size chart PDFs, booklet chart PDFs, NOAA RNC tile service, and online RNC viewer. Cancellation of these products and services will start in mid to late 2020 and be completed by January 2025, according to NOAA.
For nearly 200 years, NOAA’s Office of Coast Survey has produced traditional paper nautical chart products. Originally, this took the singular form of hard copy paper charts, which in the early years were hand engraved works of art. The artist James McNeill Whistler, for example, learned copper plate etching while working on charts for the office of coast survey.
Since the notice was posted in the federal register last week, NOAA has heard from mariners grieving about the end of an era, van Westendorp said. He said he sympathized with that sense of loss, but emphasized that the shift would lead to better, more detailed charts.
“I was raised on paper charts and I learned to navigate on paper chars,” he said. “But there is a difference now with the next generation of mariners. We are teaching them on paper charts, but they love the electronic methods of navigating.”
Since 2008, electronic chart sales have increased by 425%, while sales of paper charts have dropped by half, according to a NOAA press release.
Lee Estes, president of Maptech, a private contractor that prints a number of navigational products based on NOAA data, said he understands the reasoning behind the decision. But he hopes the federal agency will take the time to make the process as seamless as possible.
“On their web site it says they will start shutting off raster and paper in the middle of next year. I would hope they don’t shut off any of these charts until they have a suitable replacement,” he said. “We support NOAA and will work them; we just want it done right.”
Maptech’s products include cruising guides, waterproof charts and chartbooks, chart kits, and marine digital software. The company will continue producing those products using the ENC data, Estes said.
But he hoped NOAA would work on its vcustom chart program to make the resulting charts look more like the traditional ones being replaced.
NOAA’s protytpe custom chart application is intended to enable users to create their own charts from the latest ENC data, defining the scale and paper size of custom-made nautical charts centered on a position of their choosing. Users may then download, view, and/or print the output.Van Westendorp stressed that the new application is still under development.
He is correct. I checked it out and had trouble printing a chart of my home harbor, the Fox Island Thoroughfare. I was unable to get the chart to include depths unless I zeroed in on too small an area to be useful for navigating. And I missed seeing local landmarks identified, such as North Haven’s water tower. Actually, the island of Vinalhaven was mislabeled as the Gulf of Maine.
“It’s still in development. We want feedback,” Van Westendorp explained.
Despite phasing out the creation of new paper charts, NOAA will include the old versions in its archives where users can still access them. https://historicalcharts.noaa.gov
While the decision to phase out the older chart system has been made, the details of the five-year transition are not yet set. Van Westendorp urged interested people to submit comments through NOAA's online feedback tool by February 1, 2020. https://nauticalcharts.noaa.gov/customer-service/assist/
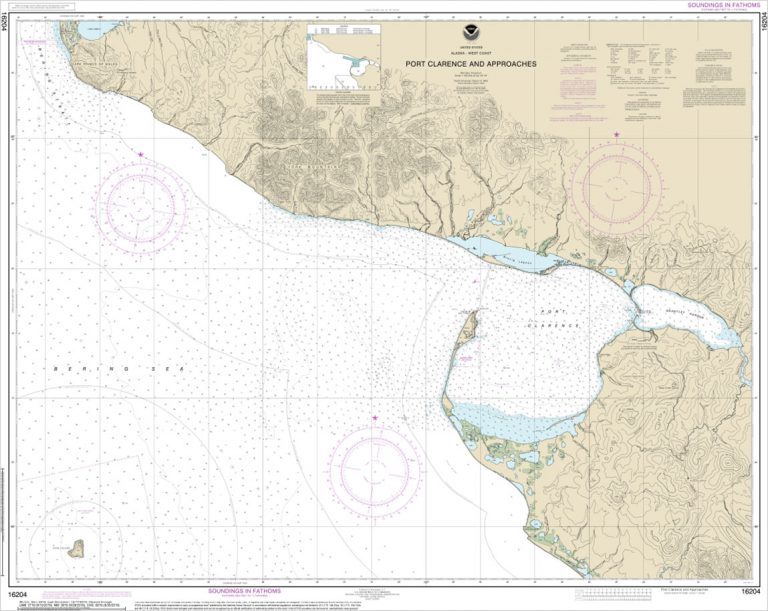
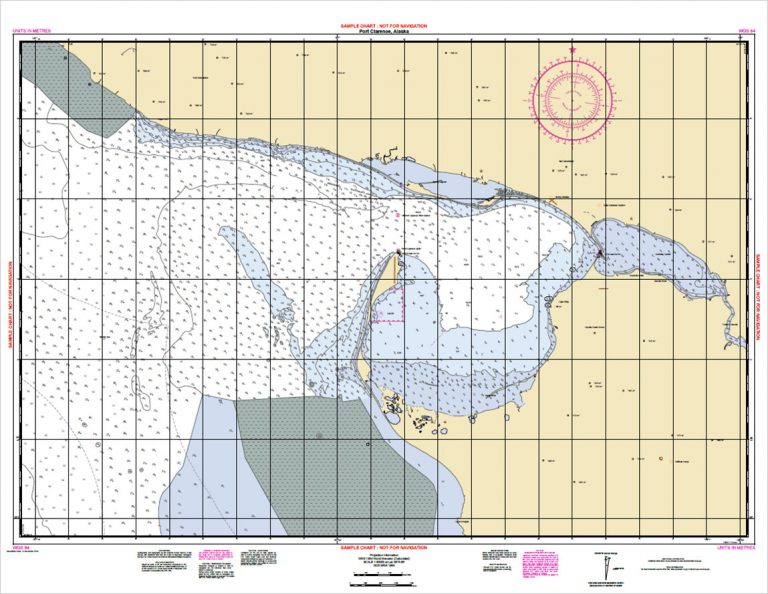
Here are samples of an old version chart and the new ENC. The top chart is a traditional version of 1:100,000 scale NOAA paper nautical chart 16204. The bottom on is a 1:80,000 scale NOAA Custom Chart of Port Clarence, Alaska.
For more on how charts are made, see our story here:
https://maineboats.com/print/issue-144/charting-coast